22 A Simple Vaccine Intervention
EpiModel built-in network models also include parameters for a simple intervention that affects the probability of infection given contact between a susceptible and an infected person. This could be a vaccine that reduces susceptibility, for example. This mini-tutorial shows how to implement one.
To keep the focus on the intervention rather than the substrate, we step away from STIs here: take the nodes to be people in a workplace or a school, and the edges to be recurring close contacts. Nothing about the machinery changes.
A time step is arbitrary; it takes whatever unit we choose when we set durations and rates. We treat a step as a week in this tutorial, whereas the SIS tutorial treated it as a day.
To get started, load the EpiModel library.
Research-level models would implement more complex interventions with more parameters or greater population structure; we discuss that in NME-II.
Download the R script to follow along with this tutorial here.
Interventions in this simple built-in approach have three salient features:
- They apply to everyone in the population. There is no heterogeneity in who gets the intervention.
- The interventions have an efficacy,
inter.eff, where the intervention results in a relative reduction in the probability of infection specified ininf.probbyinter.eff. - Interventions start at a defined time step,
inter.start.
The built-in intervention is a deliberately simplified stand-in for a vaccine. It is:
- universal: every node receives it at full strength. There is no coverage below 100%, no heterogeneity in uptake, and no targeting.
- instantaneous: it is at full effect from
inter.startonward. There is no roll-out period, dosing schedule, or delay to protection. - leaky: it multiplies the per-act transmission probability by
1 - inter.efffor everyone, partially lowering risk on every exposure. This is the leaky mechanism, as opposed to an all-or-nothing vaccine that fully protects a fraction of recipients and leaves the rest unprotected.
It also does not model waning: the effect is constant and never decays. A research vaccine analysis usually adds several of these pieces, partial coverage and uptake, a roll-out or dosing schedule, waning efficacy, and a choice between leaky and all-or-nothing protection. Those are custom-module extensions (NME-II and the EpiModel Gallery), not parameters of the built-in model.
We estimate a very simple temporal ERGM: a 100-node network with an edges-only formation model, where the target of 50 edges sets the mean degree to 1 (\(50 = 1 \times 100 / 2\)). The network is smaller and denser than in the tutorials so the intervention’s effect is easy to see.
This model simulates an SI disease in a closed population in which the vaccine has a very strong efficacy for the entire population. The intervention starts at week 25. We run a baseline arm alongside it, because inter.eff is a relative reduction and there is nothing to see it against otherwise.
Code
init <- init.net(i.num = 5)
control <- control.net(type = "SI", nsteps = 100, nsims = 10, ncores = 5)

1param.base <- param.net(inf.prob = 0.5)
param.vax  <- param.net(inf.prob = 0.5,
2                        inter.eff = 0.96,
3                        inter.start = 25)

sim.base <- netsim(est, param.base, init, control)
sim.vax  <- netsim(est, param.vax,  init, control)

par(mfrow = c(1, 2))
plot(sim.base, ylim = c(0, 100), main = "No intervention")
plot(sim.vax, ylim = c(0, 100), main = "Vaccine (96%), step 25")- 1
- The baseline arm. Identical in every respect except that it has no intervention parameters at all.
- 2
-
inter.effis the relative reduction ininf.prob. At 0.96, the per-act probability drops from 0.5 to \(0.5 \times (1 - 0.96) = 0.02\). We leaveact.rateat its default of 1 here, so each partnership involves one act per step and this per-act probability is also the per-partnership probability (unlike the SIS tutorial, whereact.rate = 2made the two differ). - 3
-
inter.startis the time step the intervention switches on. Before it, the two arms are the same model.
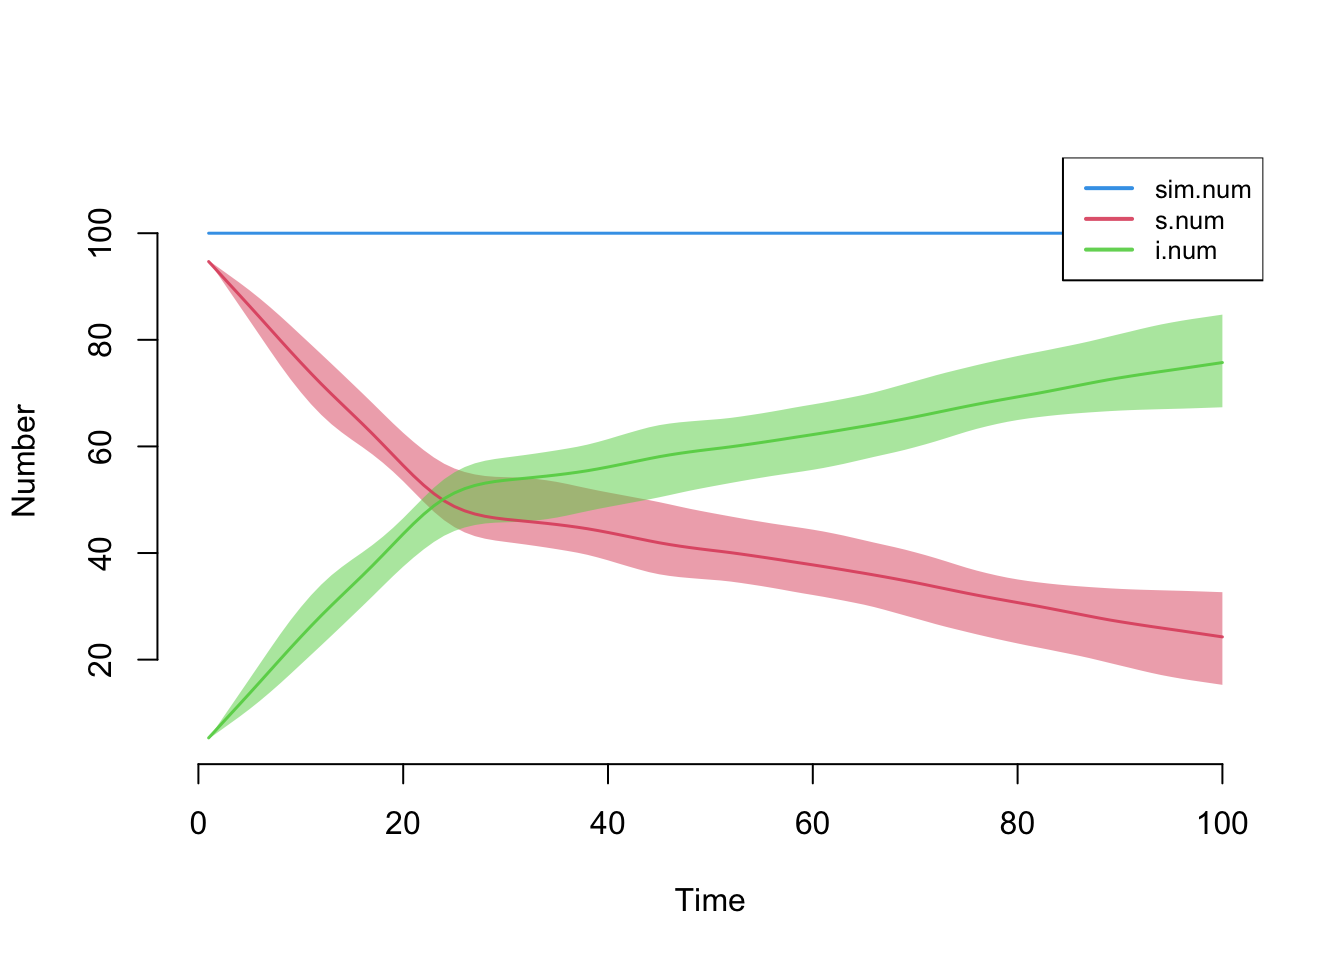
The left panel is what would have happened anyway. The bend at step 25 in the right panel is the vaccine, and it is only legible against that comparison.
Notice that even this very strong vaccine does not stop the epidemic: most of the population still becomes infected, and the count keeps climbing to the end of the run. In an SI model there is no recovery, so the small residual per-act probability of 0.02 accumulates over repeated contacts. The vaccine slows the spread and delays saturation, but with no way for infection to clear, it cannot prevent it. The SIS example below adds recovery, which is what finally lets a leaky intervention drive prevalence down.
The next model simulates an SIS disease in which the intervention is less effective, and starts at week 100.
Code
init <- init.net(i.num = 10)
control <- control.net(type = "SIS", nsteps = 250, nsims = 10, ncores = 5)

param.base <- param.net(inf.prob = 0.5, rec.rate = 0.07)
param.vax  <- param.net(inf.prob = 0.5, rec.rate = 0.07,
                        inter.eff = 0.8, inter.start = 100)

sim.base <- netsim(est, param.base, init, control)
sim.vax  <- netsim(est, param.vax,  init, control)

par(mfrow = c(1, 2))
plot(sim.base, ylim = c(0, 100), main = "No intervention")
plot(sim.vax,  ylim = c(0, 100), main = "Intervention (80%), step 100")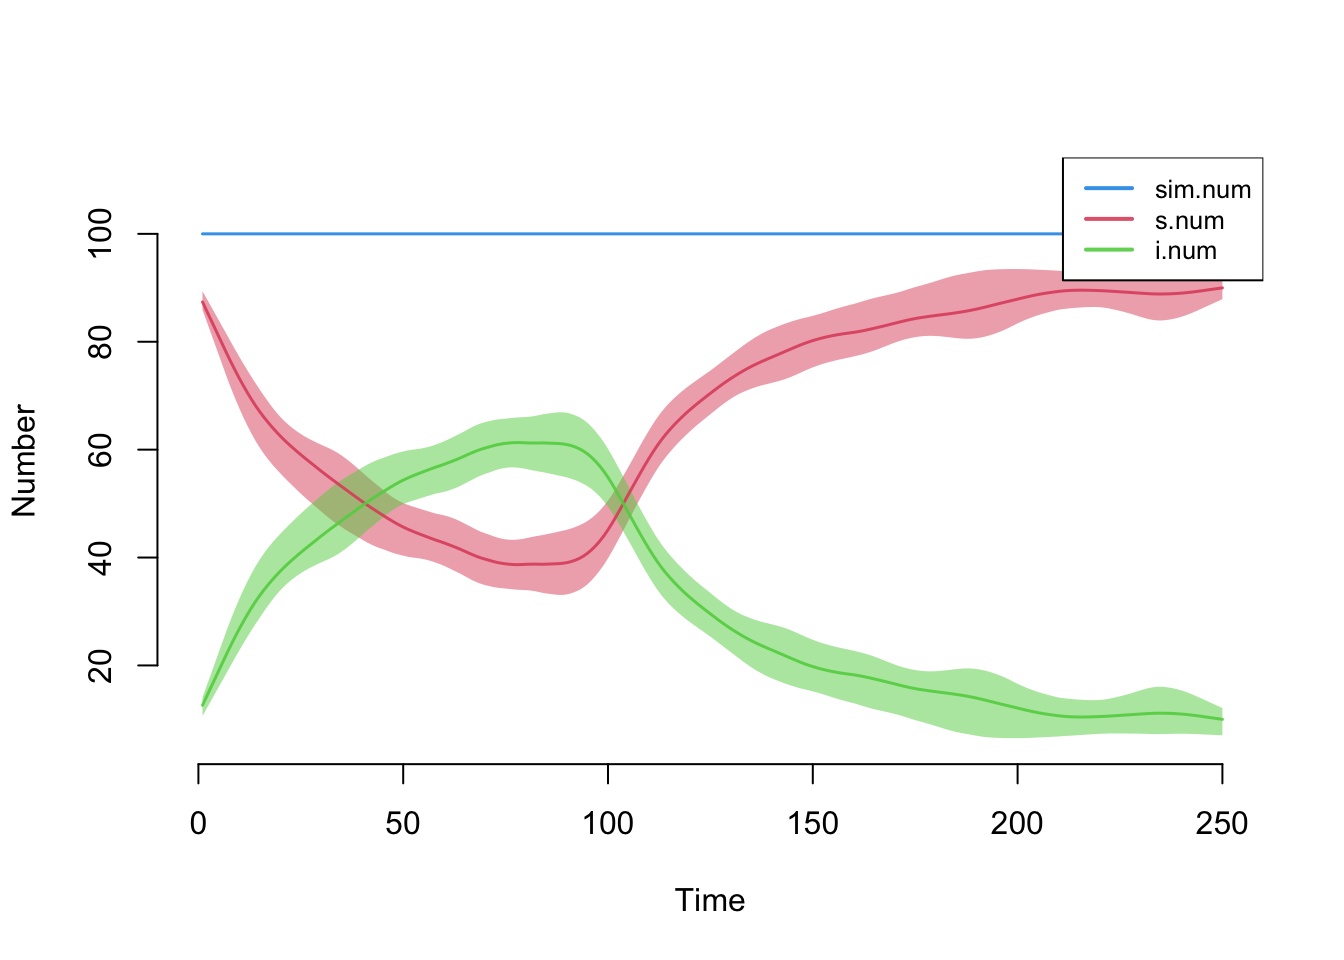
The SIS case is the more interesting comparison. The baseline arm settles at an endemic equilibrium and stays there. The intervention arm tracks that same equilibrium until the intervention switches on at step 100, and then prevalence falls steadily toward elimination. Cutting the per-act probability by 80% (from 0.5 to 0.1) is enough here to push the infection below the threshold it needs to sustain itself, so it dies out rather than settling at a new nonzero level. This is the key contrast with the SI model above: there, with no recovery, even a 96% vaccine only delays saturation; here, recovery gives the infection a way to disappear once transmission is pushed low enough.