29 Introduction
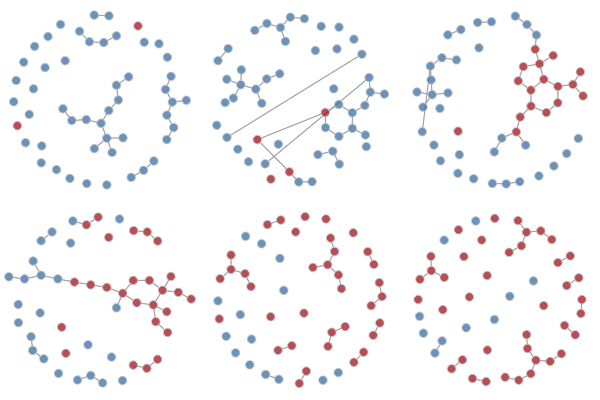
In this module, we demonstrate how to build a dynamic network visualization of an epidemic model using EpiModel and the R package ndtv. These dynamic visualizations are a powerful way to demonstrate what is happening “under the hood” of EpiModel, and also to directly demonstrate how network configurations lead to different epidemic dynamics.
We highlight different ways to plot dynamic aspects of the network object, and then use ndtv to build interactive network movies. We note that dynamic visualizations are best produced on a small scale (fewer nodes on a small set of time steps) to increase clarity of communication.
29.1 Module Learning Objectives
- Extract dynamic network data from an EpiModel object.
- Produce different static plots of the dynamic contact network and transmission network from this object.
- Generate a dynamic network animation from this object.
- Describe how counterfactual network parameterizations generate different epidemic patterns.
